
$4B
NRO commercial imagery programme
EOCL over ten years with options; the 2026 request cut it by about a third
Setcoin Intelligence · Space Infrastructure · Earth Observation · Updated October 2026
What is satellite data worth per square kilometre and per revisit, who pays for it, and does AI change who captures the value? Ninety-eight chapters on sensors, fleets, prices, government and commercial buyers, the operators, constellation economics, foundation models, sovereign deals, regulation and risk, built on company filings, contracts, public price lists and Setcoin's satellite catalogue analysis.
Open to everyone: the first 3 chapters in full, with exhibits and models; a free account adds their Excel models. Space subscription: all 101 chapters, every model and Excel file, 7-day free trial, then €199 a month. Already a reader? Sign in.
In short
Satellite imagery is getting cheap and the money is moving elsewhere. Planet lists SkySat archive at $6 per square kilometre and Satellogic at $4; constellations collect far more than they sell. Value sits in guaranteed access (assured tasking at $40 and sovereign capacity deals) and in answers sold per asset or decision. Governments buy about two-thirds, and growth has moved from US intelligence, whose commercial imagery budget was cut in the 2026 request, to European and Asian defence. SAR leads: ICEYE reported over €250 million of 2025 revenue and raised at over €10 billion. Free data and AI foundation models make analytics cheaper, shifting margin to whoever owns the customer's decision.
01 · The answer
Imagery prices are falling at the low end. Planet lists SkySat archive (about 50 cm) at $6 per square kilometre and Satellogic its archive at $4; resellers quote 30 cm archive at about $17–26. On Setcoin's constellation model, a 30-satellite high-resolution fleet must sell about a fifth of what it collects just to cover its costs at those prices.
The money is in guaranteed access and in answers. Assured tasking lists at $40 per square kilometre, and sovereign deals, in which a government buys capacity or whole satellites, drove 2025–2026 growth at Planet ($116.1 million in one quarter, +58%), BlackSky (+50%, international +200%) and Satellogic (+259%).
Governments buy about two-thirds of commercial EO. Growth has moved from US intelligence, where the 2026 request cut the NRO's commercial imagery line from about $300 million to $200 million a year, to European and Asian defence: Germany's roughly €1.7 billion SAR constellation with Rheinmetall and ICEYE, Sweden, Poland, Japan.
Radar is the growth engine and AI the leveller. ICEYE has 57 SAR satellites in orbit and reported over €250 million of 2025 revenue. Free Sentinel data and foundation models such as AlphaEarth, Prithvi and Clay make analytics cheaper, so value moves to labelled history, accuracy and the customer's workflow.
98 chapters + 3 appendices · 180 min · updated 2026-10-23
02 · The evidence
$4B
EOCL over ten years with options; the 2026 request cut it by about a third
€1.7B
Rheinmetall–ICEYE joint venture; production from Q3 2026
$815M
About half due within twelve months; satellite services drive growth
Free
10–30 m every few days: the price floor every paid product must beat
03 · The price ladder
List prices per square kilometre in 2026, from free government data to assured tasking. Large buyers negotiate lower; minimum orders and cloud raise the effective price for small sites.
$ per km²
Planet and Satellogic list prices as reported (Sep 2026); reseller guides for 30 cm.
Try the model
Sixteen agile optical satellites can look at a mid-latitude point about every four to five hours; one satellite about every three days; a 56-satellite SAR fleet about every hour. Add cloud to see how long you really wait for a clear optical image.
Interactive model
How many hours pass, on average, between opportunities to image a mid-latitude point, for a given fleet?
| Item | Value |
|---|---|
| Area within reach per satellite per day (M km²) | 350.9 |
| Daylight factor | 0.5 |
| Average revisit (hours) | 4.36 |
| Expected wait for a clear look (hours) | 4.36 |
What moves “Average revisit” most: each input 20% lower (left of a pair) and 20% higher
This is one of 5 interactive models in the report. The first 3 chapters of the report are open to everyone; a Space subscription, with a 7-day free trial, opens every model and its Excel file.
04 · Three findings
From company results, government contracts and Setcoin's models, October 2026.
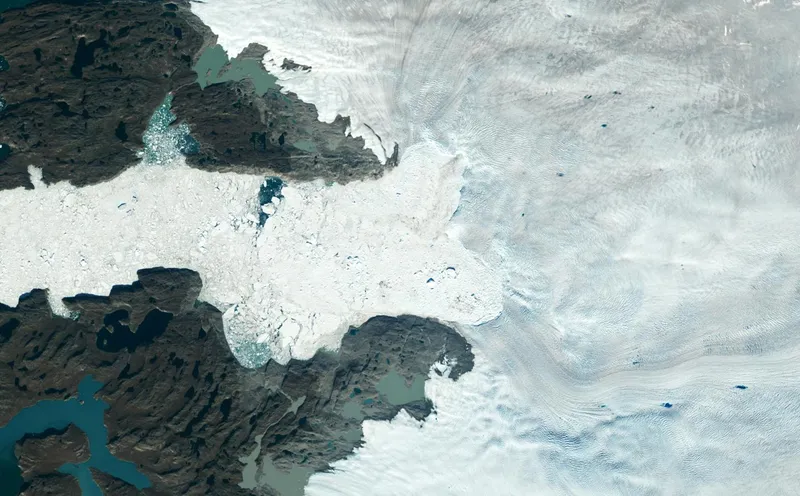
After a week in March 2025 when Ukraine lost access to US-licensed imagery, defence ministries bought capacity they control: Germany, Sweden, Poland, Japan and others.
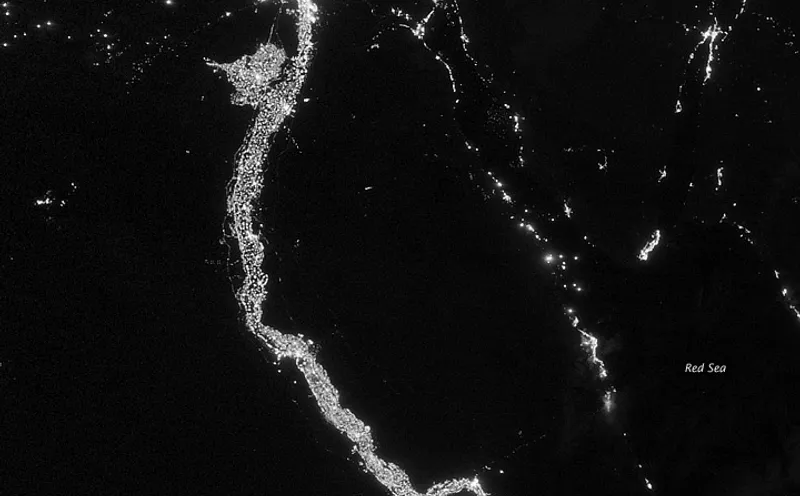
ICEYE's 57 satellites, flood maps in hours for insurers, dark-ship detection for navies: SAR is the fastest-growing part of commercial EO.
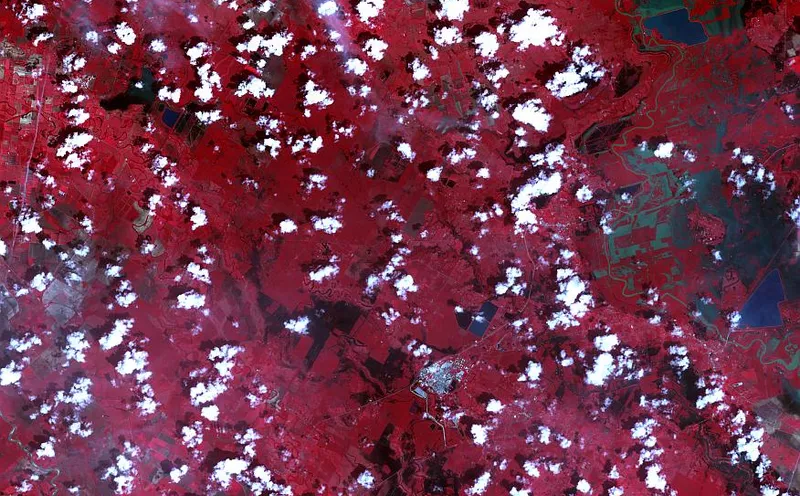
On Setcoin's model, analytics margins are about 80% on free data and about 40% on $10/km² imagery. Owning the customer's workflow matters more than owning pixels.
Try the model
A 30-satellite high-resolution fleet costs about $4.60 per square kilometre it collects and about $23 per square kilometre it sells at 20% utilisation. Switch to a sovereign deal, a SAR fleet or a monitoring fleet.
Interactive model
What does a fleet spend per square kilometre it sells, and how much of its collection must it sell to cover costs?
| Item | Value |
|---|---|
| Annual cost ($M) | 100 |
| Area collected a year (km²) | 21,900,000 |
| Area sold a year (km²) | 4,380,000 |
| Cost per km² collected ($) | 4.566 |
| Cost per km² sold ($) | 22.831 |
| Break-even share at the compared price | 38.1% |
What moves “Cost per km² sold” most: each input 20% lower (left of a pair) and 20% higher
This is one of 5 interactive models in the report. The first 3 chapters of the report are open to everyone; a Space subscription, with a 7-day free trial, opens every model and its Excel file.
05 · Who operates it
Operators, government programmes and a key polar ground station. Ringed: the largest fleet in its class or a sovereign programme. Switch between world, North America, Europe and Asia-Pacific.
Sovereign or largest fleet · hover or tap a site for detail
Optical operators
SAR and RF operators
Government programmes and ground stations
Company and agency statements; fleet counts from Setcoin's catalogue analysis, 20 Oct 2026.
Try the model
An illustrative $440 million company with 60% government revenue, 40% of it from US intelligence, still grows 17% after a 30% US cut if sovereign and commercial sales grow. Lose the US line with no growth elsewhere and revenue falls 24%.
Interactive model
If US intelligence buys less, how much revenue does an EO company keep, given growth elsewhere?
| Customer group | This year ($M) | Next year ($M) |
|---|---|---|
| US intelligence | 105.6 | 73.9 |
| Other government | 158.4 | 221.8 |
| Commercial | 176 | 220 |
| Total | 440 | 515.7 |
What moves “Revenue next year” most: each input 20% lower (left of a pair) and 20% higher
This is one of 5 interactive models in the report. The first 3 chapters of the report are open to everyone; a Space subscription, with a 7-day free trial, opens every model and its Excel file.
06 · Signals to watch
07 · Check it yourself
Every figure here comes from filings, contracts and the public satellite catalogue. These Setcoin services let you check companies and projects yourself.
Satellites in the public catalogue, contracts, ownership, sanctions listings and court records on an EO company, in one cited report.
See what Verify checks →Infrastructure projects worldwide, with satellite change detection to check construction where registers are silent.
Open the Atlas →Capital groups by sector, stage, structure and ticket size.
Explore Capital Map →08 · The full study
How often a fleet can see a mid-latitude point, from satellites, pointing width and day or night sensing.
What a fleet spends per square kilometre it sells, and the share of collection it must sell at a given price.
How an EO company's revenue responds to a cut in US intelligence purchases and growth elsewhere.
Free data tools
The study's findings move with launches, contracts and filings. These free Setcoin tools show the current public record behind them, refreshed from the catalogues and procurement registers.
607 new US federal space awards and European tenders from the last twelve months, by part or service bought, buyer, country and stage, with the tenders still open.
See which agencies are buying EO data and analytics, what they publish as value, and the tenders still open.
Open the radar →Type an operator’s name and see what the public satellite catalogues record: satellites launched, in orbit, operating and re-entered. The full check adds US contracts, SBIR awards, UK and NOAA licences and list screening.
Check what the catalogues record for an EO operator’s fleet: launched, operating and re-entered satellites.
Check an operator →Questions
Sentinel-2 and Landsat imagery is free. In 2026 Planet lists SkySat archive (about 50 cm) at $6 per square kilometre, flexible tasking at $12 and assured tasking at $40; Satellogic lists archive at $4. Resellers quote 30 cm archive at about $17–26 and tasking at about $25–55. Minimum orders, often 25 km², raise the effective price for small sites.
Published estimates for 2025 range from about $3.8 billion to $8 billion depending on what is counted. Setcoin's bottom-up estimate of satellite data plus first-level analytics is about $4.5–6 billion, of which governments buy about two-thirds. Setcoin's base case reaches about $13–17 billion by 2035.
The FY2026 budget request proposed cutting the NRO's Electro-Optical Commercial Layer from about $300 million to about $200 million a year and zeroing a commercial radar line. Congress's intelligence committees moved to restore funding; final figures are classified.
For control in a crisis, speed and cost. In March 2025 Ukraine's access to US-licensed imagery was suspended for about a week. Since then Germany (about €1.7 billion with Rheinmetall and ICEYE), Sweden, Poland, Japan and others have bought satellites or dedicated capacity.
Synthetic aperture radar images the ground with microwaves, through cloud and at night. It suits defence, maritime surveillance, flood mapping and ground-movement monitoring. ICEYE, the largest commercial SAR operator with 57 satellites in orbit, reported over €250 million of revenue in 2025.
On Setcoin's approximation, one agile optical satellite can look at a mid-latitude point about every three days, sixteen about every four to five hours, and a 56-satellite SAR fleet about every hour. Cloud lengthens the wait for a clear optical image.
Foundation models such as Google's AlphaEarth Foundations, NASA and IBM's Prithvi and Clay are pre-trained on large archives, so new tasks need far fewer labelled examples. That makes analytics cheaper to build and moves value to labelled history, accuracy and integration into customers' decisions.
On Setcoin's model, monitoring 1,000 km² weekly costs about $104,000 a year with free Sentinel data plus analytics, about $172,000 with 3 m monitoring imagery, and about $915,000 with 50 cm flexible tasking.
Planet reported $116.1 million of revenue in the quarter to 31 July 2026 (+58%), positive adjusted EBITDA and a backlog of about $815 million, guiding to $430–441 million for its fiscal year. BlackSky reported $33.3 million in the June 2026 quarter (+50%), with international revenue up 200%.
The first three chapters are open to everyone in full, with no account; the rest can be previewed. A space sector subscription, with a free trial, opens all 98 chapters, the five interactive models and their Excel files.
Setcoin Research analyses public markets, filings and programmes for information only. It is not investment advice and does not recommend any security.
1. Read the first 3 chapters in full, no account needed. 2. Create a free account (two minutes, no card) to download their Excel models. 3. Subscribe to Space for every chapter, model and Excel download: 7-day free trial, then €199 a month or €1,490 a year.