
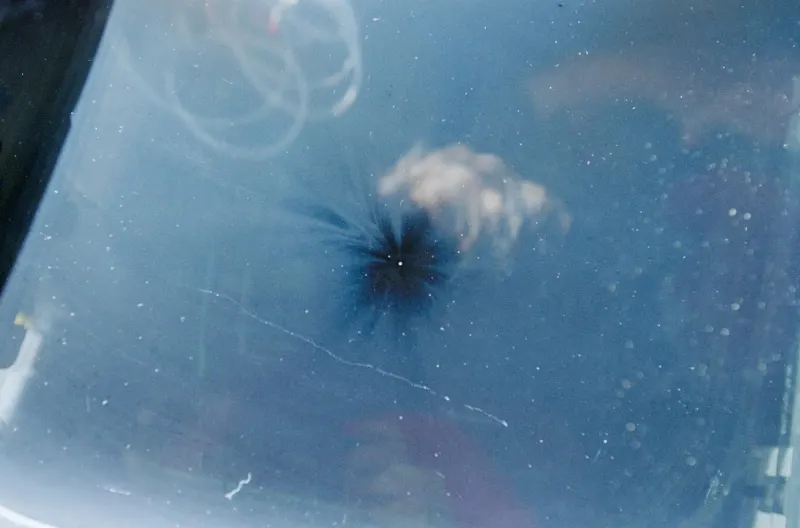
>1.2M
Fragments larger than 1 cm, mostly untracked
ESA estimate; about thirty for every tracked object, and no manoeuvre can avoid them
Setcoin Intelligence · Space Infrastructure · Insurance and Liability · Updated October 2026
Who carries the financial risk of operating in orbit, and how will debris rules, liability and traffic management change the cost of a satellite? Seventy-five chapters on the debris environment, the space insurance market, liability law, disposal rules, collision risk, traffic coordination, debris removal and who pays, built on the live satellite catalogue, ESA's 2026 environment report, Aon's 2026 market report and the rules themselves.
Open to everyone: the first 3 chapters in full, with exhibits and models; a free account adds their Excel models. Space subscription: all 78 chapters, every model and Excel file, 7-day free trial, then €199 a month. Already a reader? Sign in.
01 · The answer
The public catalogue lists about 35,000 tracked objects in Earth orbit in October 2026, of which about 17,200 are working satellites and two-thirds belong to one operator. ESA's models add more than a million fragments larger than 1 cm, too small to track and large enough to end a mission. ESA's 2026 report concludes that debris in low orbit would keep growing even if launches stopped.
The space insurance market is small and selective. It took in a little over $650 million of premium in 2025 against about $503 million of claims, according to Aon, after a 2023 in which claims of $1.43 billion swamped about $550 million of premium. Twenty-five insurers can place about $375 million on one satellite in orbit. Most constellation satellites carry no in-orbit cover at all, so most of the risk in orbit never reaches an insurer.
Debris has become a priced loss. In late 2025 a particle of a few grams ended the mission of SpainSat NG II, reported to be insured for about $400 million. Liability for such losses is theoretical: in space it depends on proving fault, and the 1972 Liability Convention has produced one settled claim, for C$3 million in 1981. On the ground, the launching state is liable whether or not anyone was at fault.
The rules are moving costs to operators: disposal within five years in the US and at ESA, propulsion and daily screening for constellations in the proposed EU Space Act, and liability limits set by mission risk in the UK. Removing one derelict costs $40–90 million today, and governments are the only buyers. Fees, bonds and insurance conditions are the tools that would make operators pay for the risk they impose; none yet operates at scale.
75 chapters + 3 appendices · 182 min · updated 2026-10-27
02 · The evidence
>1.2M
ESA estimate; about thirty for every tracked object, and no manoeuvre can avoid them
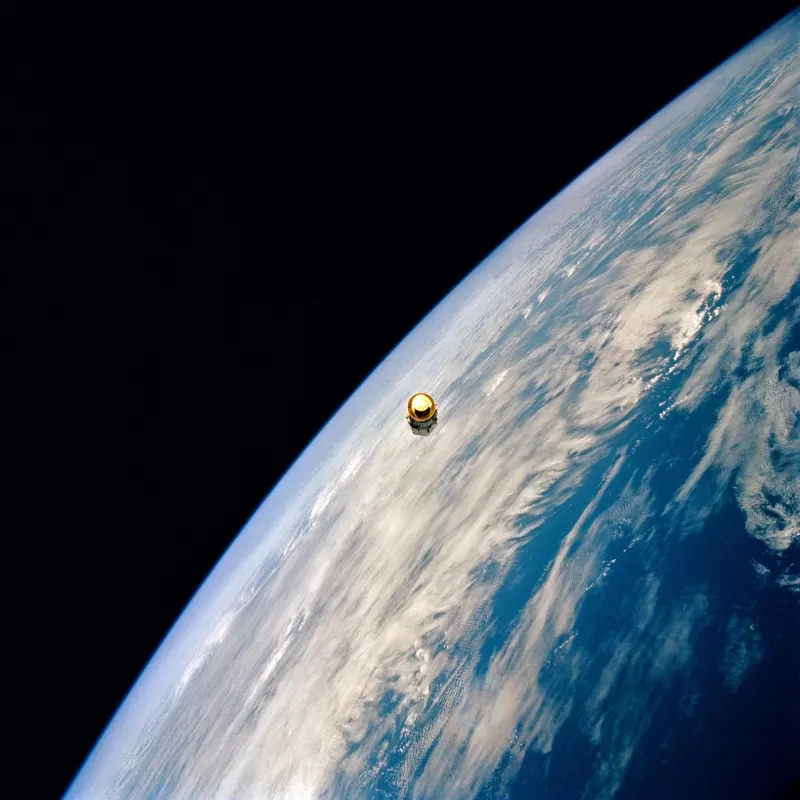
$1.43B
Against about $550 million of premium; the five-year margin turned negative for the first time since 2001 (Aon)
207,152
December 2025 to May 2026, about forty a year per satellite (SpaceX filing, as reported)
1
Cosmos 954 over Canada, C$3 million in 1981, half the amount claimed
03 · The market
Launch and in-orbit premium and claims by year of occurrence, as estimated by Aon. One large loss can absorb most of a year's premium; two make a loss year.
$M
Aon Space Insurance Market Report, Q1 2026; 2024 claims derived from the reported ~$383 million result.
Try the model
Start from the 750–800 km band, which holds about 1,670 tracked objects, mostly debris: a 10 m² satellite there has about a 1 in 6,750 chance a year of hitting a tracked object, about 1 in 1,350 over five years. Switch to the busiest band, add untracked debris or try a large rocket body left for a century.
Interactive model
How likely is a satellite to collide with a tracked object in a given altitude shell over its mission, and how many collisions would a fleet expect?
| Item | Value |
|---|---|
| Shell volume (km³) | 3.209e+10 |
| Effective objects | 1,506 |
| Effective density (per km³) | 4.693e-8 |
| Expected collisions per satellite-year | 1.481e-4 |
| Annual probability | 1.481e-4 |
| Probability over 5 years | 7.402e-4 |
| Expected fleet collisions | 0.074 |
What moves “Chance of collision a year” most: each input 20% lower (left of a pair) and 20% higher
This is one of 5 interactive models in the report. The first 3 chapters of the report are open to everyone; a Space subscription, with a 7-day free trial, opens every model and its Excel file.
04 · Three findings
Setcoin's reading of the catalogue, the market reports and the rules; arithmetic as labelled in the study.
Large constellations insure launches at most and keep in-orbit losses themselves. Their risk appears in no premium statistic.
Liability in space requires proving fault. The 2009 collision of two intact satellites produced no claim, and untracked fragments cannot be traced to an owner.
Japan, the UK, ESA and the US defence establishment are the only buyers of removal. No operator pays to clean an orbit it shares.
Try the model
A $300 million geostationary satellite with launch-plus-one-year cover at 9% and four further years in orbit at 1.2% a year pays about $41.9 million, about 14% of its value. Try the soft market of early 2023, a hard market after another loss year, or a small low-orbit satellite.
Interactive model
What does launch, in-orbit and third-party liability cover cost for a satellite, and what loss probability does the rate imply?
| Item | Value |
|---|---|
| Launch plus one year ($M) | 27 |
| In-orbit cover ($M) | 14.4 |
| Third-party liability ($M) | 0.5 |
| Total premium ($M) | 41.9 |
| Share of value | 14.0% |
| Implied first-year loss probability (%) | 6.3 |
What moves “Total premium” most: each input 20% lower (left of a pair) and 20% higher
05 · Geography
Insurance is written mainly from London, Paris, Munich, Tokyo and Dubai; rules come from Washington, Brussels and national agencies; removal missions are contracted in Japan, the UK and Switzerland. Ringed: capture-and-removal missions under government contract. Switch between world, North America, Europe and Asia.
Removal mission contracted · hover or tap a site for detail
Insurance markets
Regulators and traffic services
Tracking and removal companies
Aon Q1 2026; regulators; agencies and companies; examples, not a complete list.
Try the model
A bond equal to the cost of removing one satellite, about $10 million with a future multi-target servicer, would be ten times the cost of a $1 million constellation satellite. Pooled across 1,000 satellites with a 3% failure rate and a twofold margin, it falls to about $0.6 million each, about $60,000 to carry over five years.
Interactive model
How large would a disposal bond be per satellite and per fleet, and what would carrying it cost?
| Item | Value |
|---|---|
| Per-satellite bond ($M) | 10 |
| Fleet total if every satellite posts a full bond ($M) | 10,000 |
| Expected failures | 30 |
| Pooled fleet bond ($M) | 600 |
| Pooled bond per satellite ($M) | 0.6 |
| Carrying cost per satellite a year ($) | 12,000 |
| Carrying cost per satellite over 5 years ($) | 60,000 |
| Share of unit cost | 6.0% |
What moves “Pooled bond per satellite” most: each input 20% lower (left of a pair) and 20% higher
06 · Signals to watch
Check it yourself
The study's findings move with launches, contracts and filings. These Setcoin tools show the current public record behind them.
8 large constellations against what they are licensed or filed for: satellites launched, re-entered and net pace over twelve months, and the date each milestone is reached at that pace.
See how fast each large constellation is filling its shells, and how many of its satellites have re-entered.
Open the monitor →607 new US federal space awards and European tenders from the last twelve months, by part or service bought, buyer, country and stage, with the tenders still open.
See who is buying space surveillance, tracking and debris services, awarded and open.
Open the radar →Type an operator’s name and see what the public satellite catalogues record: satellites launched, in orbit, operating and re-entered. The full check adds US contracts, SBIR awards, UK and NOAA licences and list screening.
Check an operator’s fleet in the catalogues: satellites operating, inactive in orbit and re-entered.
Check an operator →Cited R&D awards and prime contracts in space and aerospace, by organisation and readiness gate, from public procurement and grant records.
Open the space sector record →Registrations, ownership, sanctions listings and court records for an operator, servicer or insurer counterparty in one report.
See what Verify checks →A space-safety company's round, filings and statements checked against the public record, to the same standard as this study.
Check a company →Questions
The public catalogue listed about 35,000 tracked objects in orbit in October 2026: about 20,100 payloads, of which about 17,200 were working, about 12,500 fragments and about 2,300 rocket bodies. ESA estimates more than 50,000 objects larger than 10 cm and more than 1.2 million larger than 1 cm, most of them too small to track.
Small. Aon estimates launch and in-orbit premium at a little over $650 million in 2025, with claims of about $503 million and a loss ratio of 77.4%. In 2023 claims reached about $1.43 billion against about $550 million of premium. Twenty-five insurers wrote space risk in early 2026, with working capacity of about $425 million for a launch and $375 million for a satellite in orbit.
Rarely in orbit. A constellation satellite may cost under a million dollars, and losing a few a year only degrades service, so operators such as SpaceX keep in-orbit risk themselves and rely on spares. Some constellations insure launches of batches of satellites. As a result most satellites in orbit carry no insurance after launch.
Under the 1972 Liability Convention, damage in space is compensated only if the launching state of the other object was at fault, which is hard to prove: there is no treaty standard of care, tracking data are often restricted and small fragments cannot be traced. In practice the damaged operator and its insurer bear the loss. Damage on the ground or to aircraft is different: the launching state is liable whether or not it was at fault.
Once under the treaty. When the nuclear-powered Soviet satellite Cosmos 954 scattered radioactive debris over northern Canada in 1978, Canada claimed about C$6 million and settled in 1981 for C$3 million, without the USSR formally admitting liability. No claim for damage in orbit has ever been settled.
That small debris can destroy a large insured satellite. SpainSat NG II, launched in October 2025, was struck during its transfer to geostationary orbit by a particle the operator estimated at a few millimetres and a few grams. In January 2026 it was declared non-recoverable. Its insured value was reported at about $400 million, the largest part of the market's 2025 claims.
The international benchmark was 25 years after the end of the mission. The US FCC adopted a five-year rule in 2022, applying to satellites launched from September 2024, and ESA's 2023 standard also requires five years plus a cumulative collision probability below 1 in 1,000 until re-entry. ESA's data show that many satellites that must actively dispose of themselves still fail to.
In Setcoin's shell model, a 10 m² satellite in the 750–800 km band has about a 1 in 6,750 chance a year of colliding with a tracked object, about 1 in 1,350 over five years. Untracked fragments can raise that several times. The risk per satellite is small, but it adds up across a fleet and over the century-long lives of large derelicts.
Today about $40 million per object for the UK's two-object CLEAR mission, awarded to ClearSpace for about £61 million in October 2026, and roughly $80–90 million for Japan's single-object ADRAS-J2. Multi-target servicers could bring the cost below $15 million per object in the 2030s. Governments are the only buyers so far. Setcoin analyses public markets and programmes for information only and does not recommend any security.
The first three chapters are open to everyone in full, with no account; the rest can be previewed. A space sector subscription, with a free trial, opens all 75 chapters and 3 appendices, the five interactive models and their Excel files.
Setcoin Research analyses public markets, filings and programmes for information only. It is not investment advice and does not recommend any security.
1. Read the first 3 chapters in full, no account needed. 2. Create a free account (two minutes, no card) to download their Excel models. 3. Subscribe to Space for every chapter, model and Excel download: 7-day free trial, then €199 a month or €1,490 a year.