
Critical-lead equipment: mv switchgear, power transformers
Order early or join a pool; the same kit is contested by every sector in the region
Comprehensive institutional-level research profiling datacenter market infrastructure, AI-driven demand dynamics, investment opportunities, ESG frameworks, liquid cooling retrofit potential, and vendor financing structures for the 2026-2030 investment cycle.
Executive Summary
The global datacenter market represents a $418B opportunity in 2025, projected to reach $692B by 2030 at a 10.6% CAGR. This unprecedented growth is driven by AI workload acceleration, hyperscale expansion, and the critical infrastructure supercycle requiring up to $3 trillion in investments through 2030.
Our proprietary analysis identifies key investment windows, critical infrastructure bottlenecks, and unique financing structures that deliver 22-26% IRR for qualified institutional investors. The report provides actionable intelligence on vendor timing, EaaS optimization, and retrofit market opportunities worth $37.5-105B.
AI Workload Dominance
By 2030, AI could represent 50% of all datacenter workloads with inference becoming primary driver
Power as Primary Bottleneck
Speed to power is the #1 site selection criteria, with 100+ GW new capacity needed by 2030
Liquid Cooling Transition
52%+ of hyperscale datacenters implementing liquid cooling by 2026, creating $21B+ market
Retrofit Supercycle
15-21 GW existing capacity needs retrofit at $2.5-5M/MW, creating $37.5-105B market opportunity
Coverage Areas
Exhaustive market intelligence on each segment's technical feasibility, sustainability profile, and financial projections for institutional investment prioritization.
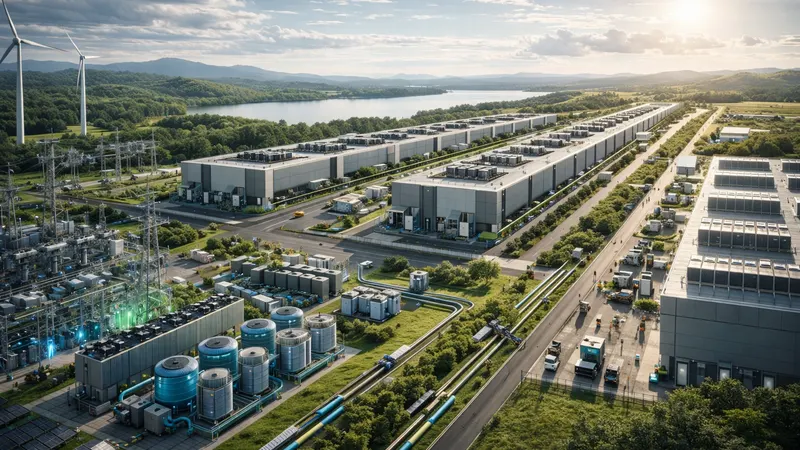
Greenfield hyperscale facilities targeting 100+ MW capacity with AI-optimized infrastructure and liquid cooling from day one.
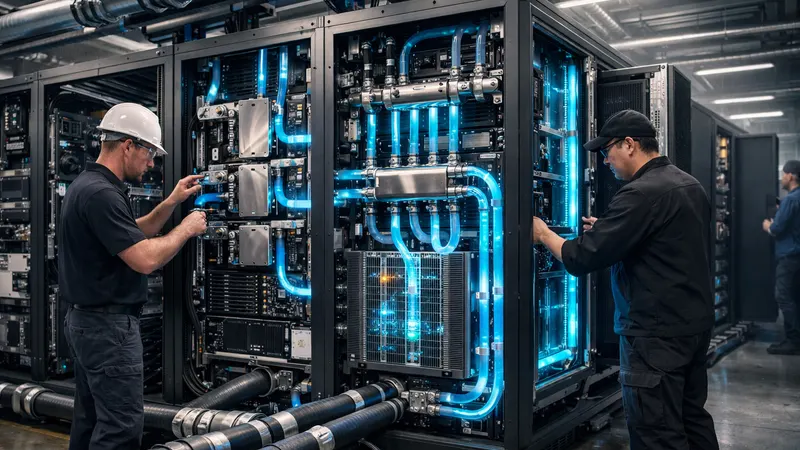
Retrofit existing air-cooled facilities to support 40-100kW rack densities required for AI/GPU workloads.
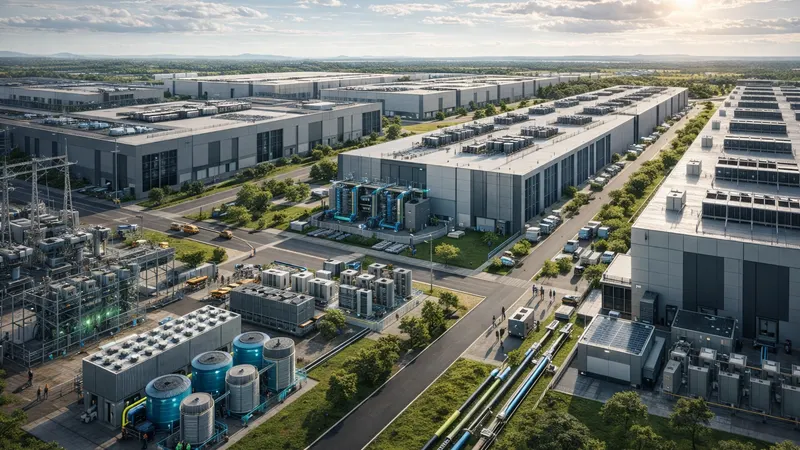
Colocation providers expanding AI-ready capacity to capture hyperscaler overflow and enterprise migration.
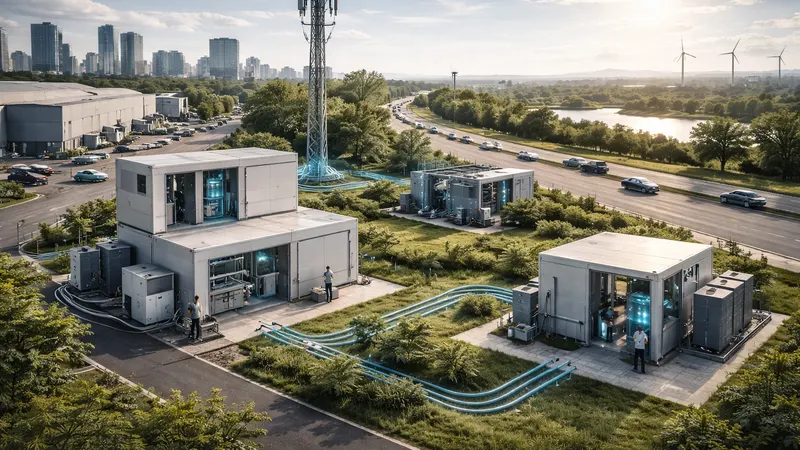
Pre-engineered modular solutions enabling rapid deployment and edge computing for latency-sensitive applications.
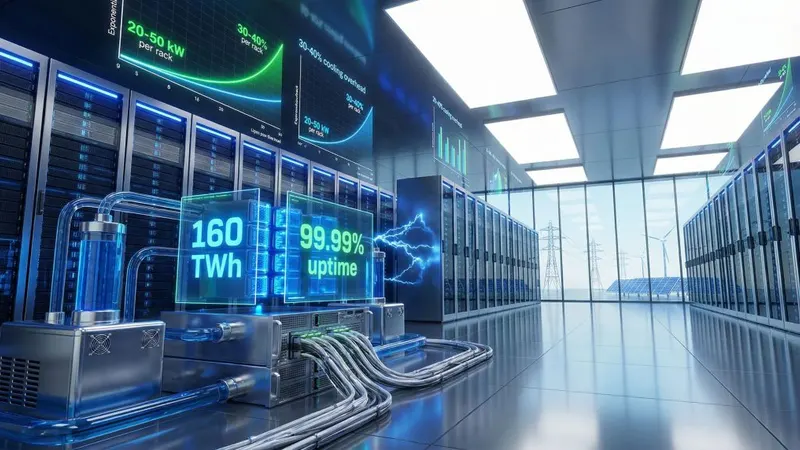
UPS systems, generators, switchgear, and renewable energy integration for datacenter power reliability.
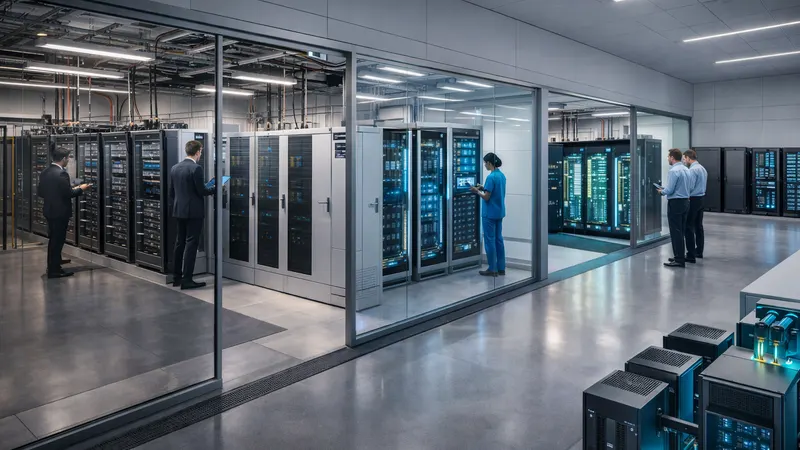
Private datacenter upgrades for banks, healthcare, and government entities adopting AI capabilities.
Infrastructure Bottleneck
The liquid cooling retrofit market represents a $37.5-105B opportunity (2026-2032) as existing air-cooled datacenters cannot support AI workload requirements
AWS, Microsoft, Google, Meta upgrading 4-8 GW for AI training. Fastest timeline (2026-2028) with aggressive deployment.
Equinix, Digital Realty, CyrusOne retrofitting to attract AI customers. 40-60% of capacity needs upgrade to remain competitive.
Banks, healthcare, governments adopting AI. Budget-constrained with longer capex cycles (2028-2032).
Financing Innovation
Transform CAPEX-heavy projects into manageable OPEX structures through Equipment-as-a-Service models, unlocking $1-1.5B retrofit deals that operators can't self-finance.
Equity Reduction: $200M → $120M
40% less equity required through vendor financing, enabling larger project portfolios with same capital base.
CAPEX → OPEX Conversion
$1.5B upfront converted to $150M/year operational expense, improving cash flow predictability.
IRR Enhancement: 20% → 24%
Higher returns through optimized capital structure and reduced upfront equity deployment.
Vendor Alignment
10-year service agreements create vendor stickiness and guaranteed revenue streams for equipment suppliers.
Proprietary Methodologies
Advanced proprietary frameworks for investment prioritization and opportunity identification in the datacenter ecosystem
Framework mapping the 36-48 month development cycle to vendor and investor engagement windows: Pre-FEED (months 6-12) and FEED (months 12-24) are the optimal entry points, when 80-90% of equipment specifications are still open, versus post-FID when 90-95% of procurement is locked.
Detailed financial modeling for retrofit investments: $1.05B investment → $377M/year benefit → 2.8-year payback, 34% IRR. Includes OPEX savings ($83M/year) and revenue uplift from AI workload premium pricing ($294M/year).
Analysis of what strategic investors can influence post-FID. Core equipment (90-95% locked) vs. cooling strategy (50% flexible) vs. renewable energy (60% flexible). Strategic investors can override 40-60% IF they join Pre-FEED.
Parallel analysis of greenfield ($50-100B) vs. retrofit ($37.5-105B) markets. Retrofit shows 3× faster sales cycle, 1.5-2× higher margins, and less competition—making it equally attractive investment thesis.
Technology Triggers
Critical market transitions creating asymmetric investment opportunities in the datacenter ecosystem
By 2027, over 50% of new hyperscale capacity will be liquid cooled. Market grows from $4.9B (2024) to $21.3B (2030) at 27.6% CAGR. Single-phase direct-to-chip becomes standard for AI workloads.
Significant shift anticipated when inference workloads overtake training as dominant AI requirement. Changes datacenter design requirements from batch processing to real-time response optimization.
Speed to power becomes #1 site selection criteria. Transformer lead times extend to 3-4 years for 500+ MVA units. Creates premium for sites with secured grid capacity and on-site generation.
Report Highlights
Setcoin Crosslink · cross-sector reads
The same technologies, supply chains and capital show up in other sectors on the Atlas. Leads to explore, not findings.
Order early or join a pool; the same kit is contested by every sector in the region
From the Capital Map, matched on sector, region, stage and ticket size
Research partners, licensors or licensees for the same technology outside this sector
Research partners, licensors or licensees for the same technology outside this sector
Research partners, licensors or licensees for the same technology outside this sector
20 grants, trials or patents in fusion, quantum work on it
Frequently Asked Questions
The report sizes the global datacenter market at $418B in 2025, reaching $692B by 2030 at a 10.6% CAGR, with 97 GW of new capacity added over 2025-2030 and up to $3 trillion of infrastructure investment required through 2030.
15-21 GW of existing air-cooled capacity needs retrofit at $2.5-5M per MW to support 40-100 kW AI/GPU rack densities — a $37.5-105B market (base case $63B). A representative 300 MW retrofit costs $1.05B, returns $377M per year, pays back in 2.8 years and yields a 34% IRR.
Tier 1: hyperscale development, liquid cooling retrofit and colocation expansion. Tier 2: edge and modular, power infrastructure. Tier 3: enterprise modernisation (3-6 GW retrofit need, $6-30B investment).
Equipment-as-a-Service converts a $1.5B upfront CAPEX into $150-180M per year of OPEX, cuts required equity from $600M to $120M, lifts IRR from 20% to 24%, shortens decision timelines from 18-24 months to 6-9 months and moves approval from board level to a VP Operations budget.
Liquid cooling mainstream adoption (over 50% of new hyperscale capacity liquid-cooled by 2027; market from $4.9B in 2024 to $21.3B in 2030), AI inference overtaking training around 2027, and the power grid constraint crisis with 3-4 year transformer lead times for 500+ MVA units.
Qualified institutional investors and fund LPs. Access is requested through the form on this page and granted at the sole discretion of Setcoin Group.
Gain access to complete market intelligence, proprietary frameworks, financial models, and detailed due diligence materials for qualified institutional investors
Available for qualified institutional investors and fund LPs