
Advanced materials and composites: 77 records in 6 other sectors
Research partners, licensors or licensees for the same technology outside this sector
Comprehensive institutional investment research profiling the definitive critical infrastructure opportunity in robotics. Deep analysis of critical bottlenecks, tiered build priorities, four flagship venture blueprints, and the $200B+ opportunity in the component layer every robot depends on. Prepared for the DSE Advanced Robotics Fund by Setcoin Intelligence.
Executive Summary
The advanced robotics industry stands at an inflection point where demand massively outstrips supply across critical bottlenecks in perception systems, manipulation hardware, and integration infrastructure. This analysis maps every critical constraint, validated by public statements from Tesla, Boston Dynamics, Figure AI, 1X Technologies, and 15+ major OEMs citing component shortages as their primary scaling constraint.
We are at the convergence moment — where AI, sensors, batteries, and manufacturing simultaneously enable mass-market robotics products. Unlike software, hardware faces 18–36 month development cycles, meaning decisions made in Q1–Q2 2026 will determine market leadership through 2030. The window for first-mover advantage is closing rapidly.
The analysis constructs a three-tier investment architecture targeting $3.6–7.0B in capital deployment across 13 infrastructure ventures, with risk-adjusted probability-weighted returns of 48% IRR and 7.0× MOIC. Each venture is profiled with detailed capital breakdowns, revenue projections, unit economics, and exit scenarios — creating the definitive playbook for capturing the robotics infrastructure opportunity.
Tactile Sensor Deficit
100× capacity gap between demand (50–100M) and supply (500K)
"Missing Middle" Grippers
Zero products exist in the $5K–$15K range critical for scale
Perception ASIC Gap
No integrated chip combines vision, LiDAR, tactile & proprioception
Energy Storage
3–4× density improvement needed for full-day mobile operation
Safety Certification
First ISO-certified humanoid expected mid-2026; 18–24 month regulatory moat
Software-First Revenue
OTA updates create 85%+ gross margin SaaS-like recurring streams
Auto OEM Anchors
Tesla, BMW, Mercedes, BYD, Hyundai deploying humanoids — 60%+ of initial volume
13M Robots by 2030
ABI Research projects nearly 13 million robots in global circulation
Critical Bottlenecks
Deep technical analysis of critical constraints blocking robotics scale-up, each validated by OEM demand data, competitive landscape mapping, and investment parameters.
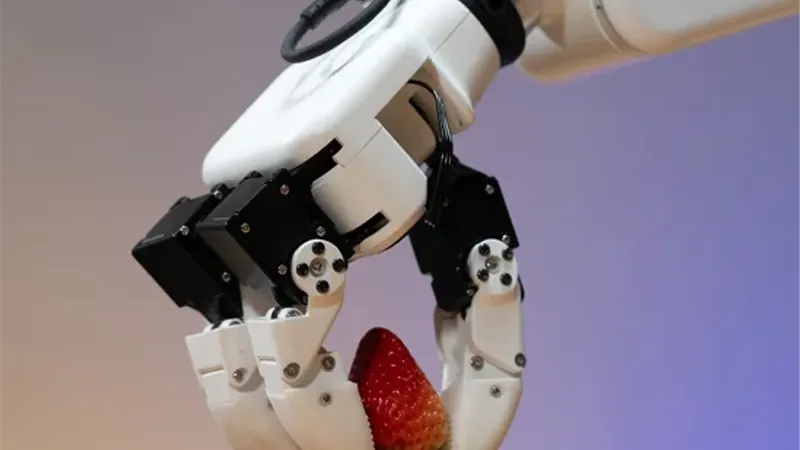
Missing market segment: $5K–15K, 12–18 DOF grippers. Shadow Hand costs $100K+, fragile. No commercially viable option between $25K industrial and $100K+ research grade.
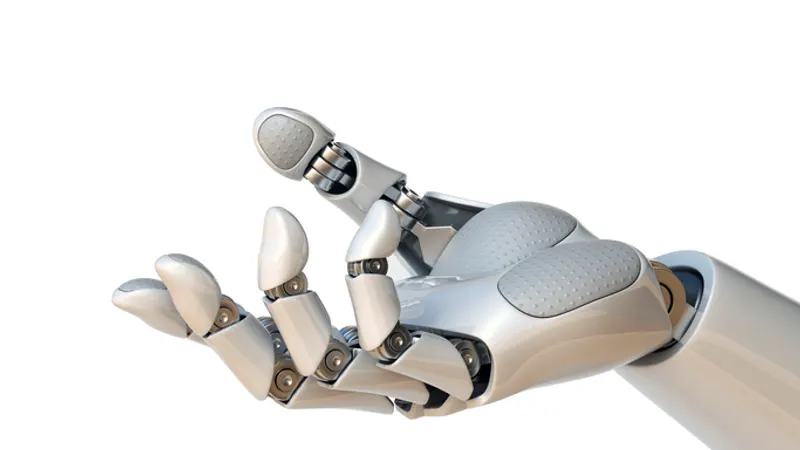
Current sensors cost $5K–$50K/gripper with limited durability. Humanoid wave requires 50–100M units by 2030 but capacity is under 500K/year. Critical shortage confirmed by Tesla, Figure AI, Boston Dynamics.
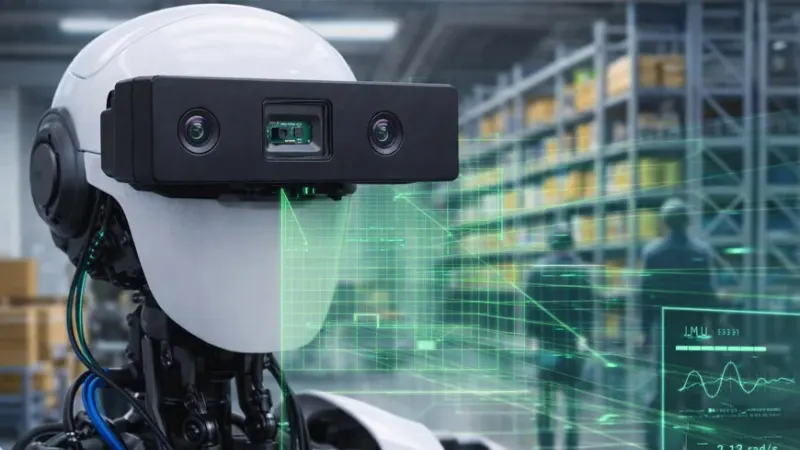
Vision systems fail dramatically outside labs. No integrated multi-modal fusion processor exists. Current approach combines expensive general-purpose compute with multiple sensor modules.
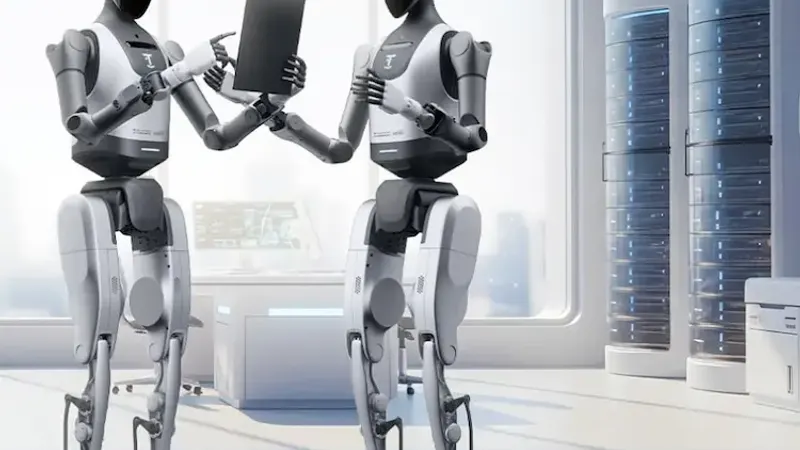
Li-ion at 250–300 Wh/kg means 20–30% of robot mass is batteries. Mobile robots need 3–4× current energy density. Solid-state at 500–700 Wh/kg is the unlock.
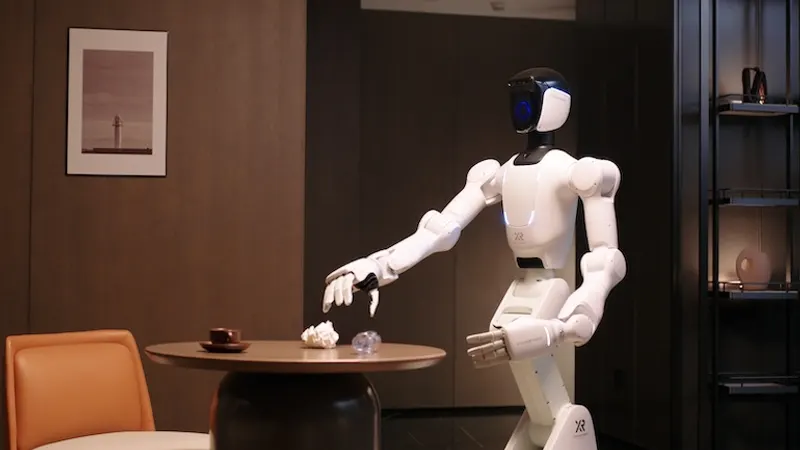
Robot manipulation data: <1M demonstrations across ALL robots vs 14M images for ImageNet. Need 100M–1B robot interaction examples. Sim-to-real gap remains 20–40%.
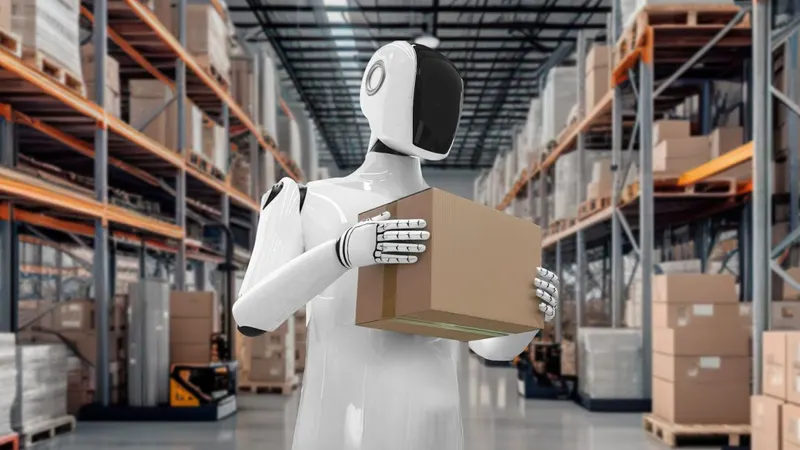
A 60kg humanoid at human speeds has lethal kinetic energy. No safety frameworks exist for AI-controlled humanoids. Required for CE/UL certification and EU AI Act compliance.
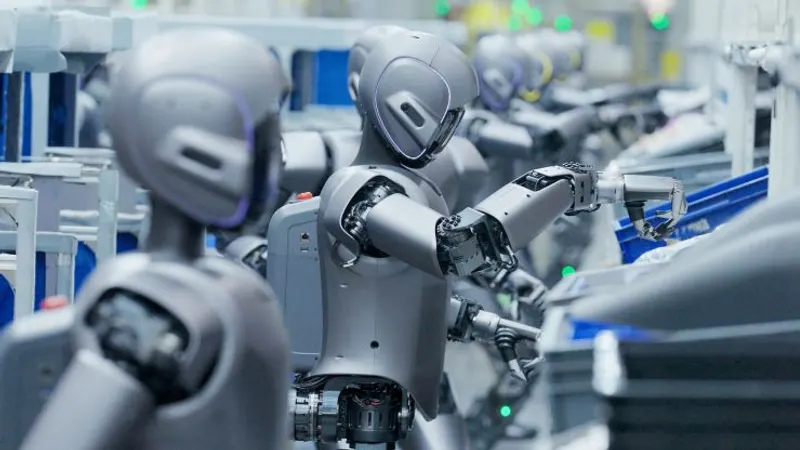
Traditional manufacturing requires 10,000+ unit volumes. Humanoid market: 100–1,000 unit batches (2026–2028). Flexible manufacturing can be profitable at 500+ units.
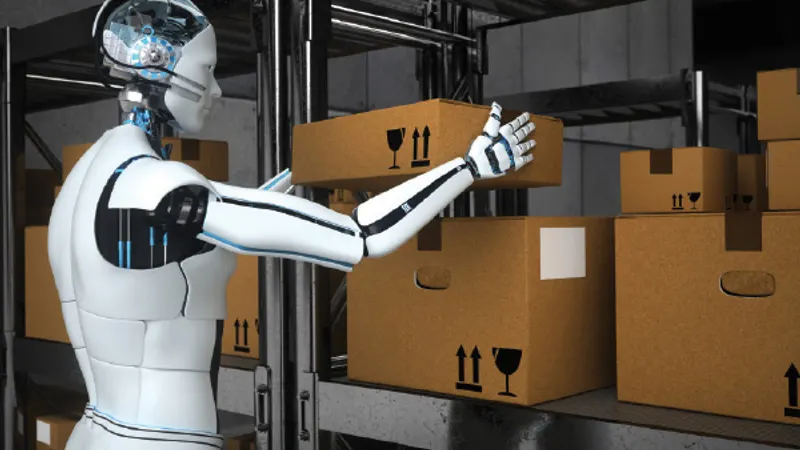
1.5M unfilled warehouse jobs in the US. Current piece-picking robots reach 200–400 picks/hour vs 600–1,000 for humans. ROI achievable in 12–24 months.
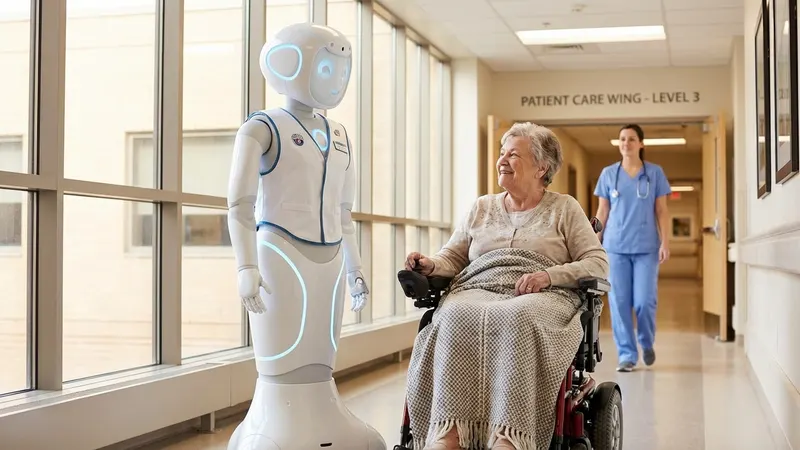
1.5B people over 65 by 2050, 3.5M caregiver deficit by 2030. Agriculture labor costs at 30–50% of crop production. High-impact but regulatory-gated opportunities.
Competitive Landscape
Companies across the humanoid, industrial, and component supply chain — mapping capital flows and remaining gaps.
Gen 3 unveiled Q1 2026 with enhanced hands and actuators. $20B capex in 2026 for production ramp. Targeting 50,000 units scaling to 1M/year capacity. $20K–$30K target price.
Vertical Integration Leader
$1B+ raised from Microsoft, NVIDIA, OpenAI, Jeff Bezos. Figure 03 launched as home humanoid. Helix 02 achieves full-body autonomy breakthrough. BMW partnership active.
$700M+ Total Funding
First commercially deployed humanoid. 7 units at Toyota Canada under RaaS agreement. Factory capacity 10K units/year. ISO safety cert targeted mid-2026.
Commercial Pioneer
$935M total Series A ($520M extension Feb 2026) at $5B valuation. Google DeepMind Gemini integration. Mercedes-Benz, GXO, Jabil deployments active.
$935M Series A
G1 at $16K, H2 at $29.9K. Targets 10K–20K shipments in 2026. Autonomous steps record in extreme conditions. China 85–90% humanoid production share.
Price Disruption Leader
World's first consumer-ready home humanoid with pre-orders. $20K or $499/month. NVIDIA GR00T N1 integration. Ships 2026 in the US.
Consumer Pioneer
Infrastructure Opportunities
Urgent infrastructure deficiencies validated by OEM demand data representing immediate high-priority investment opportunities with quantified market potential.
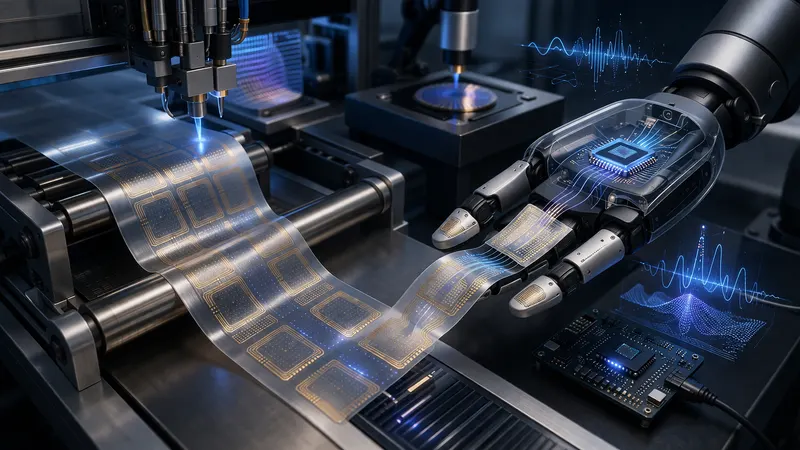
Roll-to-roll printed capacitive sensors targeting <$100/unit with 100K+ cycle durability. ASIC for on-gripper processing at <5ms latency, <2W power. No existing solution meets requirements.
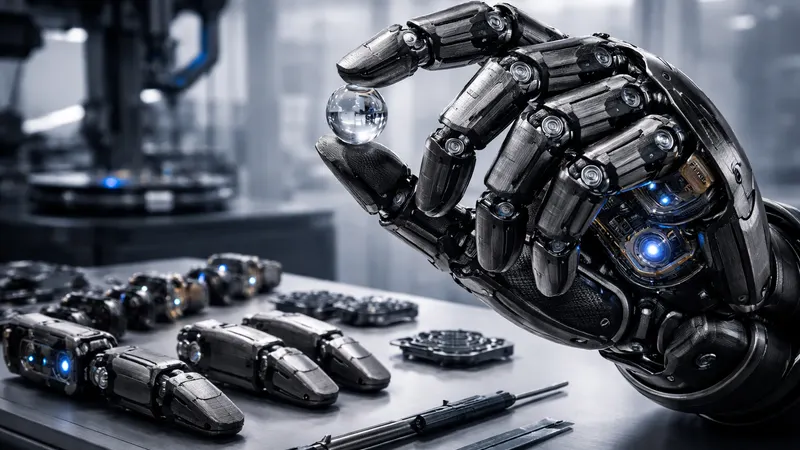
Modular anthropomorphic design: 15–20 DOF, $5K–15K range. 3D-printed titanium + brushless motors + strain wave gearing. Missing middle segment with 50K–100K unit demand.
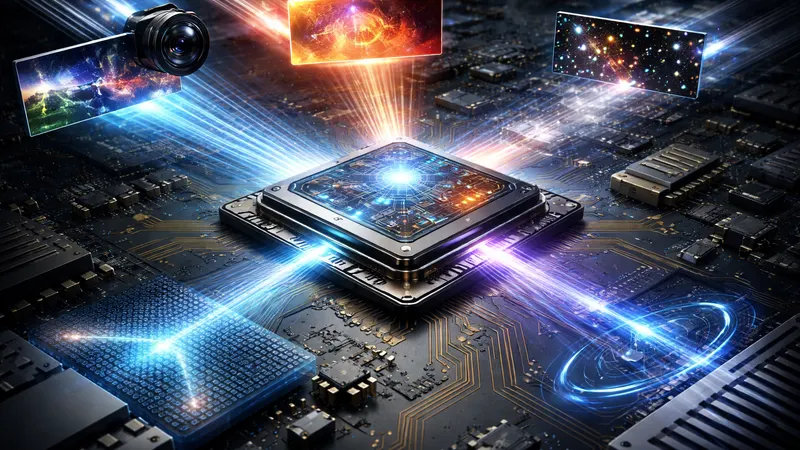
Custom ASIC: 20–40 TOPS, <15W, 7nm/5nm process. Fuses RGB cameras, thermal, event cameras, tactile, proprioception. Fabless model targeting 65–75% gross margins.
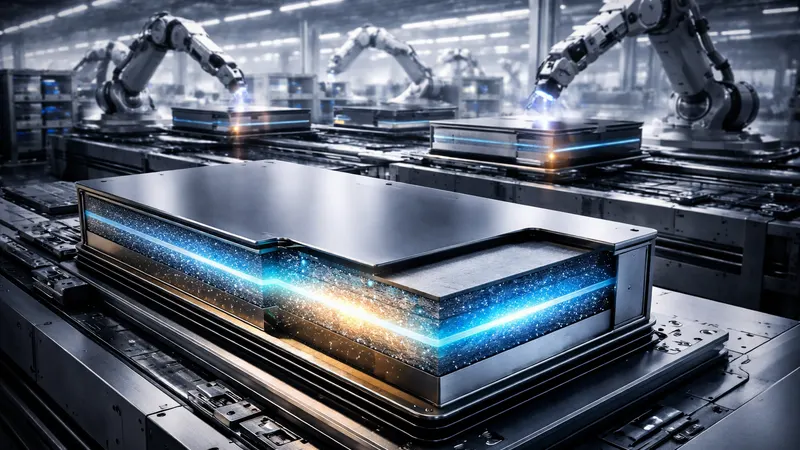
Robotics-specific solid-state: 500–700 Wh/kg targeting sulfide electrolyte with gigafactory construction. Technology proven at TRL 7–8 but production capacity allocated to automotive.

Photorealistic physics simulators with tactile simulation, automated domain randomization, and validation frameworks. SaaS platform at $5K–25K/month per team with 70–85% gross margins.
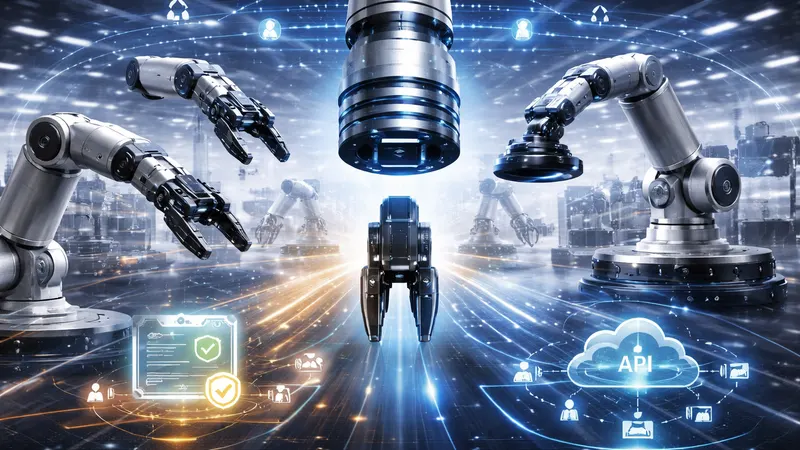
Universal Gripper Interface (USB-C for robots), Robot Operating Certificate for safety, standardized Cloud Robotics APIs. Platform and royalty business models with 75–90% margins.
Deployment Strategy
Tier 1 — Build Immediately (2026)
$1.95–3.9B
Highest-conviction bottlenecks with validated OEM demand. Each venture addresses a confirmed rate-limiting constraint with clear path to production revenue.
Tier 2 — Build 2026–2027
$1.15–2.1B
Essential enablers for production scaling, safety compliance, and ecosystem acceleration. Builds on Tier 1 to create the complete robotics infrastructure stack.
Tier 3 — Build 2027–2028
$530–980M
Platform plays with network effects and highest-margin opportunities. Benefits from Tier 1–2 creating the installed base that drives platform adoption.
Critical Success Factors
Companies and regions that move NOW on tactile sensing, gripper platforms, perception chips, and battery production will dominate through 2030. Hardware has 18–36 month cycles — Q1–Q2 2026 decisions determine leadership.
Cloud infrastructure (2008–2015), smartphone ecosystem (2010–2017), and EV battery buildout (2015–2025) all followed the same pattern. Robotics requires $5–10B to unlock $200B+ in market value.
Setcoin AI Consortium + DSE Advanced Robotics Fund creates the only vertically integrated offering from hardware components through middleware to cloud services. Infrastructure ownership de-risks application investments.
Report Contents
Setcoin Crosslink · cross-sector reads
The same technologies, supply chains and capital show up in other sectors on the Atlas. Leads to explore, not findings.
Research partners, licensors or licensees for the same technology outside this sector
Research partners, licensors or licensees for the same technology outside this sector
Research partners, licensors or licensees for the same technology outside this sector
Research partners, licensors or licensees for the same technology outside this sector
Research partners, licensors or licensees for the same technology outside this sector
97 grants, trials or patents in quantum, fusion work on it
Frequently Asked Questions
AI, sensors, batteries and manufacturing are converging to enable mass-market robots, while 15+ major OEMs — Tesla, Boston Dynamics, Figure AI, 1X — cite component shortages as their primary scaling constraint. Hardware has 18–36 month cycles, so Q1–Q2 2026 decisions determine leadership through 2030.
Tactile sensors (50–100M needed by 2030 vs under 500K/year capacity), the $5K–15K 'missing middle' dexterous gripper segment, the absence of an integrated multi-modal perception ASIC, battery energy density (3–4× improvement needed) and robot training data (<1M demonstrations vs 14M ImageNet images).
Three tiers totalling $3.6–7.0B across 13 ventures: Tier 1 core infrastructure in 2026 ($1.95–3.9B — tactile sensing, grippers, perception processors, solid-state batteries), Tier 2 scaling infrastructure 2026–2027 ($1.15–2.1B) and Tier 3 platform plays 2027–2028 ($530–980M), with probability-weighted returns of 48% IRR and 7.0× MOIC.
A $200B+ total addressable market by 2030, an $8–12B infrastructure deficit between needed capacity and current production, and an 85M global labour shortage by 2030 — with manufacturing costs projected to fall 40% by 2030.
Tesla Optimus, Figure AI, Agility Robotics (Digit), Apptronik (Apollo), Unitree Robotics and 1X Technologies (NEO), mapping capital flows, production targets and remaining gaps.
Qualified institutional investors and fund LPs. Access is requested through the form on this page and granted at the sole discretion of Setcoin Group.
Gain exclusive access to the complete global market analysis with proprietary frameworks, financial projections, and detailed company assessments.
Available for qualified institutional investors and fund LPs